
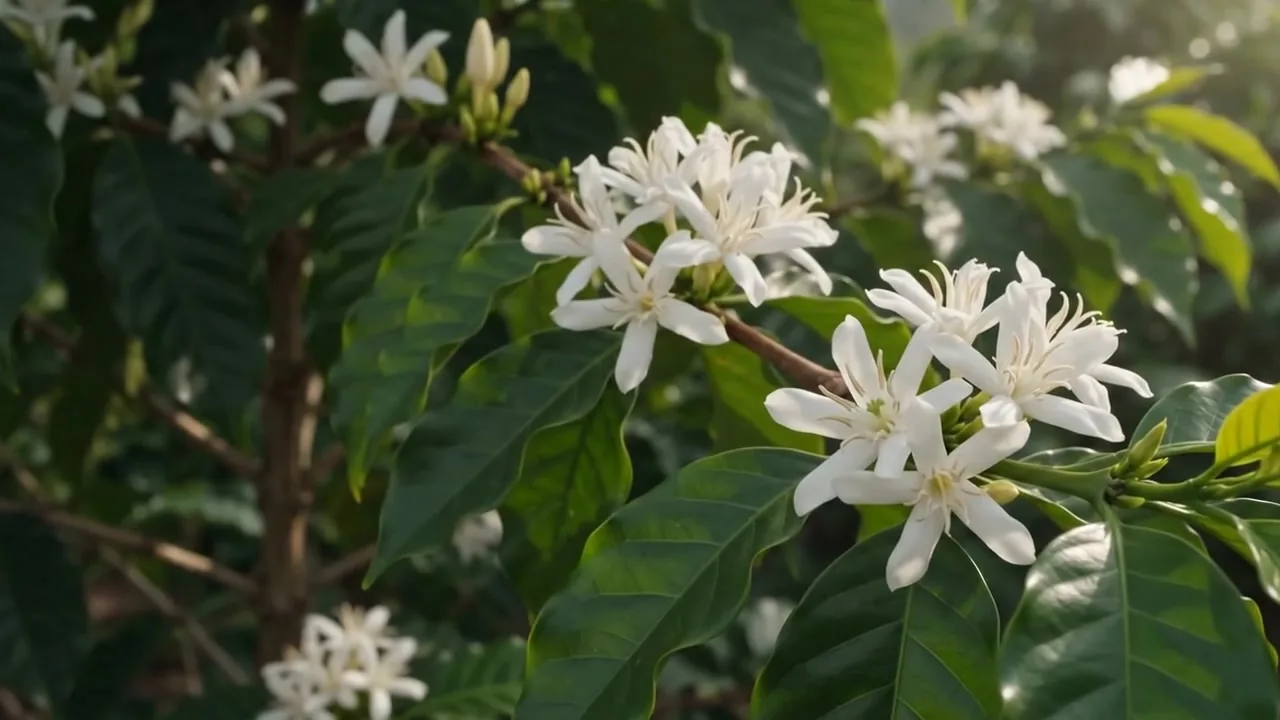
A documented pilot across three producing regions.
In the 2021–2022 season, the pilot published by Syngenta brought together 110 treated hectares, 11 farms, 8 beekeepers and 440 Apis mellifera hives.
A multicrop company
Each result shows the observed metric, study context and source supporting the number.
See results and studies →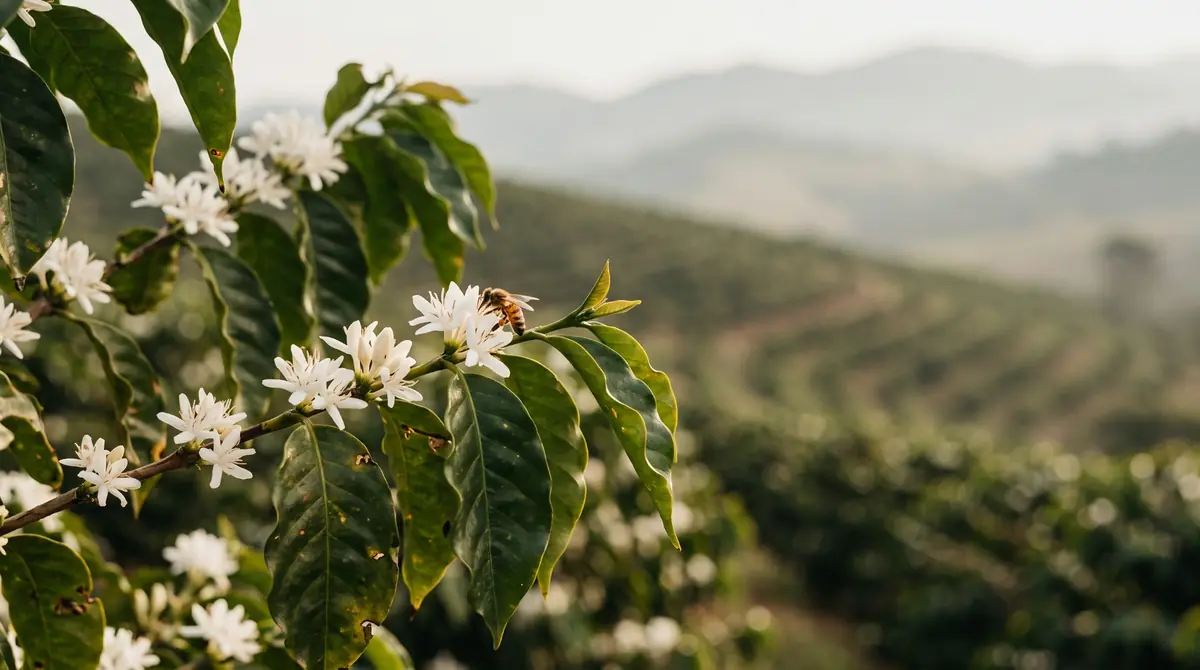
Average result observed across 23 coffee farms in southeastern Brazil.
Scientia Agricola · 2025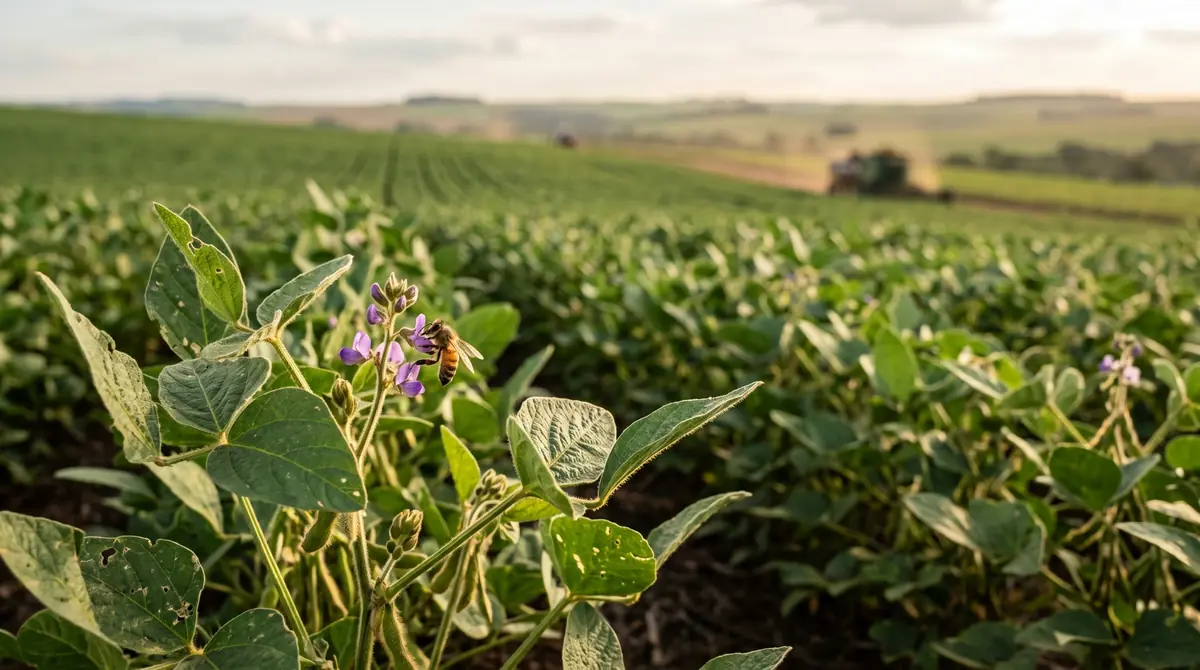
Research conducted at Embrapa Soybean over three consecutive seasons.
Journal of Apicultural Research · 2023/2024
Field-scale result measured at crop level.
Basic and Applied Ecology · 2019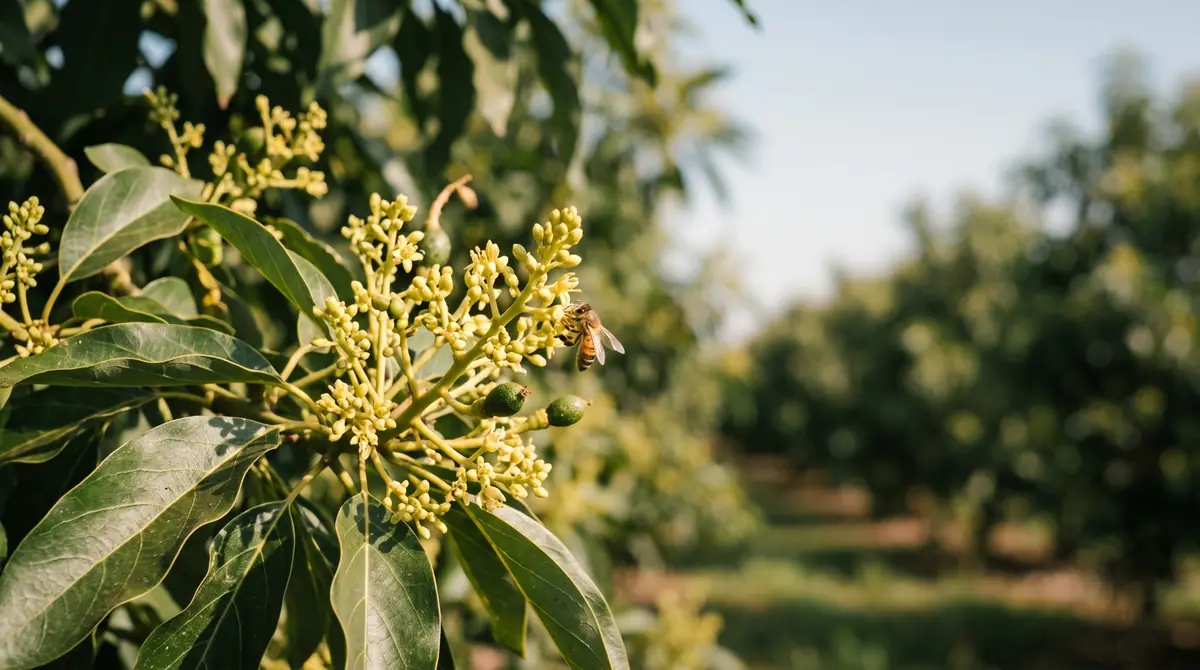
Across 36 farms, hive supplementation increased average fruit weight by 18%.
Arthropod-Plant Interactions · 2023
Direct comparison with a pollinator-exclusion treatment.
Journal of Pollination Ecology · 2026
In U.S. fields, access to the pollinator community increased seed set by 26.8%.
Journal of Applied Ecology · 2026Images in this section are AI-generated editorial illustrations. Results, metrics and sources correspond to the cited studies.
In Londrina, the hive treatment recorded 5,565 kg/ha versus 4,926 kg/ha in the treatment without pollinator access.
Self-pollination describes the reproductive mechanism. The experiment measures the agronomic response.Understand complementary pollination in soybean →
The average result comes from three consecutive seasons conducted at Embrapa Soybean.
Across 23 coffee farms in southeastern Brazil, areas closer to managed colonies showed higher production per plant than control areas farther away.
Self-compatibility and response to visitation can coexist.Understand the coffee evidence →
The result measures production per plant in coffee farms evaluated in southeastern Brazil.
Floral biology defines how the crop reproduces. Field studies show what happens to yield, fruit set or seed set when visitation changes.
Biological mechanism and agronomic outcome complement each other.Explore results and studies →
Each crop requires its own evidence, a clear metric and an appropriate comparator.
Review crop, flowering stage and field conditions to size the program.
Define colony density, placement and schedule aligned with the flowering window.
Place colonies in the field with technical follow-up during flowering.
Record and analyze the program according to crop, contracted scope and defined indicators.
The programmes below connect crops, regions, growers, beekeepers and field logistics. Research guides decisions; the operating record shows what reached the farm.
In the 2021–2022 season, the pilot published by Syngenta brought together 110 treated hectares, 11 farms, 8 beekeepers and 440 Apis mellifera hives.
Cerrado Mineiro, southern Minas Gerais and Mogiana Paulista.
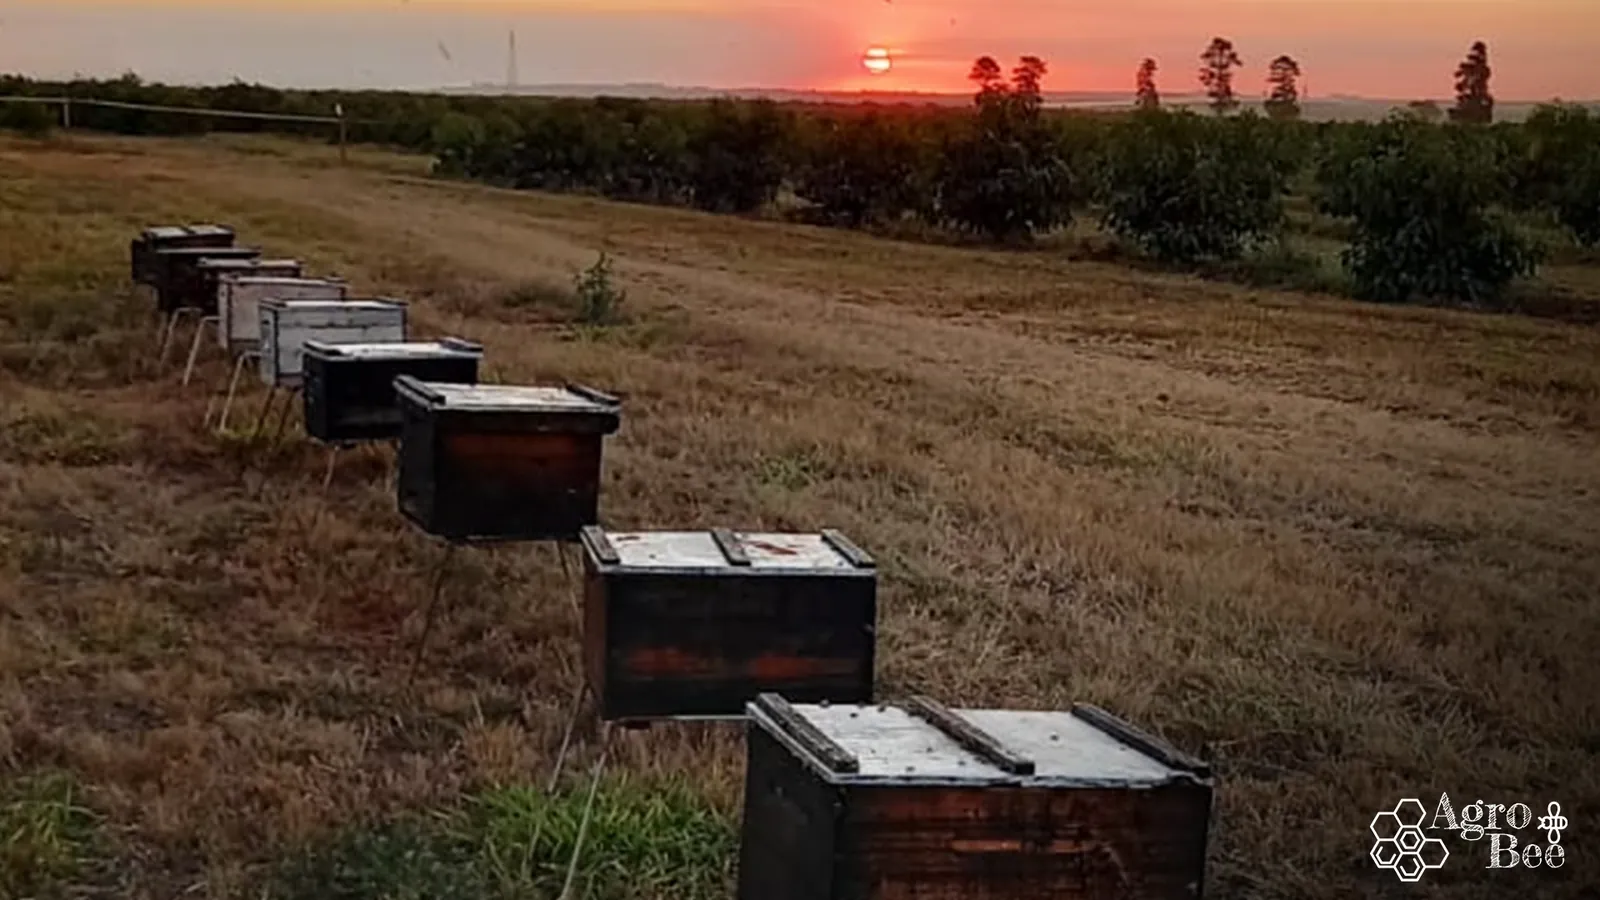
In 2024, GZH reported more than 2,500 hectares of canola in Rio Grande do Sul, with 6,000 hives, around 350 million bees and 48 beekeepers involved. In the 2025 season, more than 200 million bees were reported across 870 hectares of carinata.
Canola in Rio Grande do Sul; carinata in Erechim, Panambi, Alegrete and Santo Ângelo.
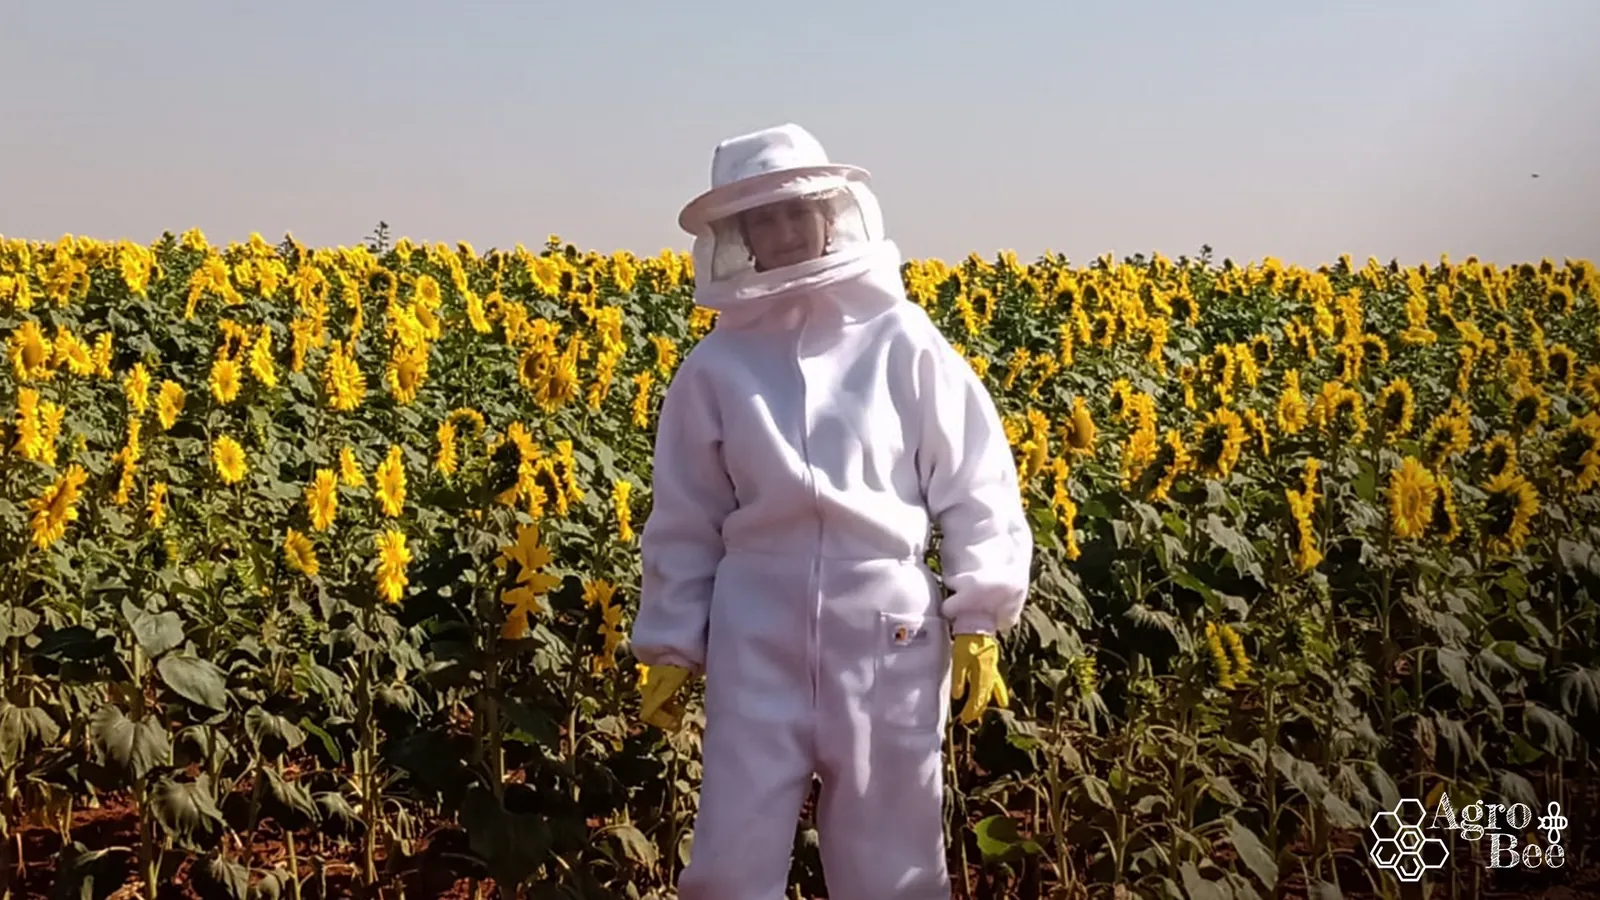
AgroBee combines technical presence, data and protocols to turn program design into a coordinated operation during the flowering window that matters.
See the operating method →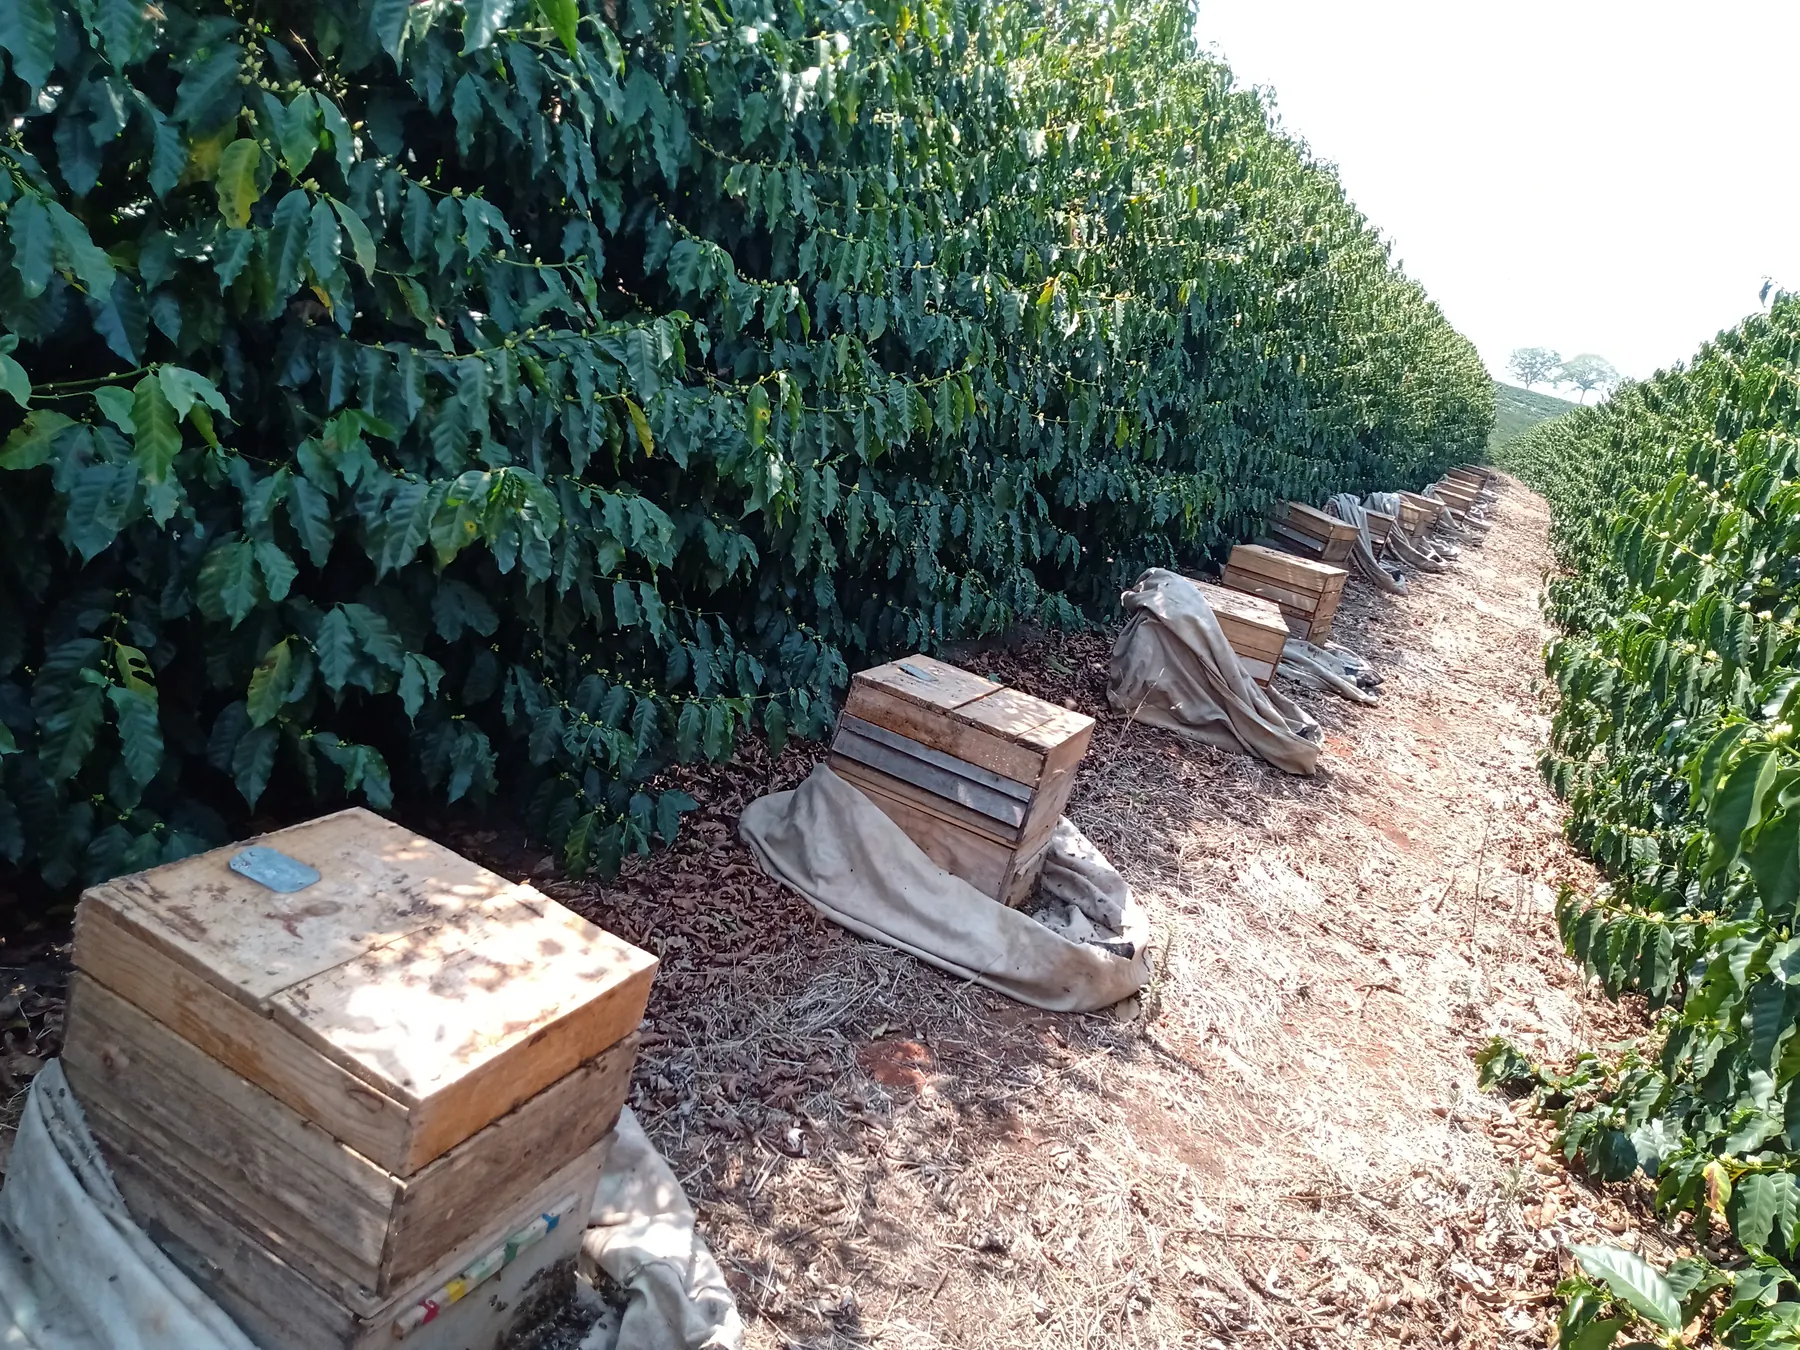
Program design based on crop, area, flowering window and operating conditions.
Deployment, coordination with crop management and follow-up during the critical flowering window.
Agronomic data, records and structured history connect execution, monitoring and interpretation of results.
Direct answers to the points that usually need to be clear before designing a pollination program.
Explore the operating method →Yes. Self-pollination describes how the plant can reproduce; it does not mean visitation is agronomically irrelevant. In coffee and soybean, field studies found measurable gains even in self-pollinating crops. The assessment should be crop-specific and use the correct metric.
Understand the soybean case →Before flowering. The plan needs to consider the flowering calendar, area, access, colony availability and quality, logistics and compatibility with crop management. The earlier this information enters the design, the better the coordination of the field window.
See how the program is planned →There is no single number that is appropriate for every crop and farm. Quantity and distribution are defined in the pollination plan according to crop, area, farm layout, colony quality, logistics and program objective.
Assess an area →Compatibility with crop management is part of planning. The operation requires communication among the farm, technical team and beekeepers to coordinate applications, hive entry and removal, and care while colonies remain in the area.
See the operating method →The service includes area diagnosis, program design, flowering-window definition, logistics coordination, colony-quality criteria, deployment, monitoring and measurement according to the agreed scope. The hive is one component of a broader operation.
Explore the method →The metric must be defined according to the crop and program objective. Yield, seed set, fruit weight and other indicators are not equivalent. The monitoring design should preserve appropriate comparators and conditions for interpreting the result.
Explore results and studies →Start with the crop, location, approximate area and expected flowering window. You can use the assessment form or start directly on WhatsApp; the team uses this context to organize the next conversation.
Start an assessment →
Assess whether assisted pollination fits your crop and area with the AgroBee technical team.